
2025 YEAR IN REVIEW: GLOBAL RALLY LED BY INTERNATIONAL STOCKS
- Rush Zarrabian, CFA®

- Jan 14
- 6 min read

Summary
The U.S. economy remained resilient in 2025. Despite a cooling labor market, a weak housing sector, and uncertainty around tariff policy, the economy continued to grow, supported by steady spending, AI-driven investment, and lower interest rates.
Markets delivered broad-based returns in 2025. International equities led after years of underperformance, U.S. large caps remained strong, bonds finally rebounded, asset allocation portfolios delivered double-digit gains, and gold had its best year since the 1970s.
2026 is off to a strong start, which historically favors further gains. Years that begin with early January strength tend to finish higher, though history also suggests investors should be prepared for double-digit pullbacks along the way.
macrocast™ continues to suggest low risk of a recessionary bear market. Our current microcast™ signal remains at an aggressive allocation. Both models continue to suggest a positive environment for risk assets.
THE U.S. ECONOMY WAS MIXED IN 2025 BUT ULTIMATLEY PROVED RESILIENT
Despite rising unemployment, uncertainty around the impact of tariffs, and a lackluster housing market, the U.S. economy expanded for a fifth consecutive year and appears positioned for continued growth in 2026.
The table below highlights several key barometers of the U.S. economy (from MarketDesk):


The unemployment rate rose to about 4.5%, up from the 2023 low of 3.4%. While the job market has clearly cooled, unemployment still remains at a historically low level consistent with a growing economy.
Consumers continued to spend, albeit more cautiously. Retail sales growth has slowed from the post-pandemic surge but has continued to grow at a steady pace, in line with the past few years. It’s worth noting that spending remains heavily dependent on the top 20% of consumers, who drive more than 40% of total consumption (chart from Goldman Sachs):

Housing remains the clear weak spot. Homebuilder confidence is near the lower end of its five-year range, as years of elevated mortgage rates continue to weigh on both new construction and buyer demand. The recent announcement that Freddie Mac and Fannie Mae will purchase $200 billion of mortgage-backed securities could help ease mortgage rates, but without adding new housing supply, the move could push home prices higher and offset the benefit of lower borrowing costs.
Overall, economic growth was solid in 2025. GDP contracted early in the year—largely reflecting tariff front-running as firms accelerated imports—but economic activity rebounded in the spring and summer and is tracking toward a strong fourth quarter.
If the economy does slow in 2026, it is more likely to reflect a loss of momentum than a breakdown. While job growth has cooled and housing remains soft, consumer spending has held up, and capital investment—particularly tied to artificial intelligence—continues to provide support. Fiscal stimulus and an improving monetary policy backdrop also provide a tailwind. Given this backdrop, a slowdown, if one materializes at all, looks far more likely to be manageable than disruptive. As outlined in our 2026 Outlook last month, a recession is not our base case, and both of our tactical models are constructive as the year begins.
2025 Asset Class Review
The following table highlights major asset class returns over the past 15 years (from Novel Investor):

Some additional takeaways from the table:
International equities stood out. Emerging markets delivered their strongest returns since 2017, and developed international stocks posted gains above 30% for the first time since 2003.
U.S. large caps had another strong year. Despite lagging international stocks by the widest margin since 2009, the S&P 500 still returned nearly 18%. That marked a third consecutive year of double-digit gains. Over the past 15 years, U.S. large caps remain the top-performing major asset class.
Bonds finally rebounded after several difficult years. The Bloomberg Aggregate Bond Index gained 7% in 2025, its best result since 2020, and a welcome recovery following four exceptionally challenging years for fixed income investors.
Novel’s Asset Allocation portfolio had its best performance since 2019. Novel Investor presents a simple asset allocation portfolio, shown in the gray “AA” box above, which combines stocks and bonds in a traditional 60/40 blend. From 2000 to 2008, this portfolio consistently outperformed the S&P 500. Over the next 15 years, that diversified approach lagged, largely reflecting the dominance of U.S. Big Tech and weaker returns from Emerging Markets and Europe. In 2025, strong international equity performance and the best bond returns since 2020 helped the AA portfolio deliver its strongest results since 2019. Continued international outperformance would provide a constructive backdrop for asset allocation strategies.
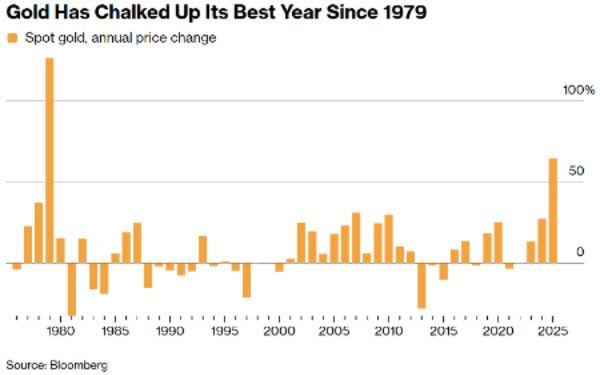
Gold delivered a historic performance. In 2025, gold surged 65%, its strongest calendar-year return since 1979. The move reflected a confluence of forces: heightened geopolitical uncertainty, sustained central bank purchases aimed at boosting reserves, and persistent investor concern around inflation dynamics (chart from Bloomberg):
THE MARKET IS OFF TO A STRONG START IN 2026, AND HISTORICALLY THAT FAVORS MORE GAINS
The market’s tone in early January has a solid track record as a directional signal. Historically, years that begin with gains in the first five trading days finish the year higher about 84% of the time, with average full-year returns in the mid-teens. By contrast, years that start with losses over the first five days have ended the year higher in a little more than half of all cases, producing average returns of only 1%. Taken together, the data suggests that early-year strength has historically been a positive indicator for equity returns over the full year (chart from Bluekurtic):

Crucially, a strong start does not reduce the likelihood of pullbacks. Even in “good start” years, markets typically experience drawdowns of 10–12% at some point along the way. A strong opening improves the odds of a good year, not the certainty of one, and as 2025 reminded us, even solid performing market years can still include significant volatility and meaningful drawdowns.
In summary, 2025 proved to be a year of resilience. The labor market cooled and housing remained under pressure from higher rates, but the economy moved past a slow start on the back of steady consumer spending and a pickup in investment tied to artificial intelligence. Despite tariff-induced volatility and an early-year correction, global asset class returns finished the year higher. International equities led after years of lagging, bonds delivered strong returns, and gold posted a historic advance. As we look ahead to 2026, the positive returns seen through the first few trading days set the tone for further gains, though history suggests the path forward is unlikely to be smooth—normal pullbacks should be expected, even if stocks end up having another good year.

Important Disclosures
The chart(s)/graph(s) shown is(are) for informational purposes only and should not be considered as an offer to buy, solicitation to sell, or recommendation to engage in any transaction or strategy. Past performance may not be indicative of future results. While the sources of information, including any forward-looking statements and estimates, included in this (these) chart(s)/graph(s) was deemed reliable, Corbett Road Wealth Management (CRWM), Spire Wealth Management LLC, Spire Securities LLC and its affiliates do not guarantee its accuracy.
The views and opinions expressed in this article are those of the authors as of the date of this publication, are subject to change without notice, and do not necessarily reflect the opinions of Spire Wealth Management LLC, Spire Securities LLC or its affiliates.
All information is based on sources deemed reliable, but no warranty or guarantee is made as to its accuracy or completeness. macrocast™ and microcast™ are proprietary indexes used by Corbett Road Wealth Management to help assist in the investment decision-making process. Neither the information provided by macrocast™ or microcast™ nor any opinion expressed herein considers any investor’s individual circumstances nor should it be treated as personalized advice. Individual investors should consult with a financial professional before engaging in any transaction or strategy. The phrase “the market” refers to the S&P 500 Total Return Index unless otherwise stated. The phrase “risk assets” refers to equities, REITs, high yield bonds, and other high volatility securities.
Corbett Road’s quantitative models utilize a variety of factors to analyze trends in economic conditions and the stock market to determine asset and sector allocations that help us gauge market movements in the short- and intermediate term. There is no guarantee that these models or any of the factors used by these models will result in favorable performance returns.
Individual stocks are shown to illustrate market trends and are not included as securities owned by CRWM. Any names held by CRWM is coincidental. To be considered for investment by CRWM, a security must pass the Firm’s fundamental review process, meet certain internal guidelines, and fit within the parameters of the Firm’s quantitative models.
Spire Wealth Management, LLC is a Federally Registered Investment Advisory Firm. Securities offered through an affiliated company, Spire Securities, LLC, a Registered Broker/Dealer and member FINRA/SIPC. Registration does not imply any level of skill or training.