
High Expectations, Narrow Margin for Error
- Rush Zarrabian, CFA®

- 15 minutes ago
- 7 min read

Summary
SpaceX’s IPO is less about SpaceX itself and more about the valuations facing the next wave of major private-company listings. The company may prove exceptional, but at a $1.77 trillion IPO valuation, investors are already paying for a great deal of future success that remains unknowable today.
Kevin Warsh is taking over the Fed at a difficult point in the cycle. Growth and employment remain firm, but the war with Iran has pushed inflation above expectations, shifting the policy conversation away from rate cuts and back toward how long policy may need to stay restrictive.
Historically, Fed leadership changes are not inherently bearish for stocks. First-year volatility has been common, but most modern Fed chairs still saw positive market returns during their first year, and every modern chair presided over gains during their full tenure.
Our microcast™ signal remains at a neutral allocation. Taken together, our tactical risk models continue to indicate a constructive backdrop for equities.
THE LESSON FROM THE SPACEX IPO IS BIGGER THAN SPACEX
SpaceX’s long-awaited public debut finally arrived on Friday. Elon Musk’s Space Exploration Technologies (SPCX) priced its IPO at $135 per share and closed its first day of trading around $161 for a 19% gain. After the first-day surge, the company already ranks as the sixth-largest publicly traded company in the country—bigger than Tesla and making Musk the world’s first paper trillionaire (data from Bespoke):

SpaceX is expected to be the first in a wave of major private-company IPOs, with Anthropic and OpenAI potentially following in the next 6-12 months.
The excitement around the IPO is real, with strong interest from both retail and institutional investors. But in our opinion, the valuation is what deserves attention. At its IPO price, SpaceX was valued at roughly $1.8 trillion, and after the first day of trading, the company closed with a market cap north of $2.1 trillion—a level that embeds extraordinary expectations for future growth, profitability, and execution (data from Bluekurtic):

Excitement around IPOs is nothing new. The problem is that the excitement often runs ahead of what the investment can realistically deliver.
The chart below shows the post-IPO performance of several high-profile U.S.-listed companies over the past 20 years, measured after the first day of trading (data from 3Fourteen):

Historically, most large IPOs delivered strong first-day gains, with a median first-day return of 13.9%. But the next 12 months were much less favorable for investors buying after trading began. The median 12-month return from the first close was -22.8%, and roughly 7 out of 10 companies were negative.
SpaceX may prove to be one of the defining companies of its generation, and OpenAI and Anthropic might belong in the same conversation. But markets do not reward greatness alone, they reward the gap between expectations and outcomes.
At today’s valuation, much of SpaceX’s future success may already be reflected in the stock. Historically, high-profile IPOs have often delivered strong first-day gains, but investors who bought after trading began frequently faced disappointing returns over the following year.
WARSH TAKES OVER AT A TRICKY MOMENT
Kevin Warsh takes over as Fed Chair at a difficult point in the cycle. The AI-driven investment boom continues to support growth, and the labor market remains on solid footing. At the same time, the war with Iran has pushed inflation higher than investors expected at the start of the year, shifting the policy conversation away from rate cuts and back toward keeping rates higher for longer.
With employment still holding up, the Fed’s dual mandate is tilted toward inflation. We would be surprised if Warsh’s first press conference spends much time on rate cuts. The more likely focus is how long policy needs to remain restrictive, and what kind of scenario would cause the Fed to raise rates again.
So far, investors have treated the recent rise in rates and inflation as temporary. The assumption is that the Iran war will not last long enough to cause a sustained increase in oil prices, and tentative progress toward a U.S.-Iran ceasefire framework lends some support to that view. Warsh does not have the same luxury. The Fed needs to show that it takes any renewed inflation pressure seriously. If investors conclude the Fed is underreacting, credibility becomes the issue — and that can quickly turn into volatility across risk assets.
DOES THE STOCK MARKET REALLY “TEST” NEW FED CHAIRS?
You may have come across the idea that markets like to “test” new Fed chairs. The theory is straightforward: a leadership change introduces uncertainty, and investors spend the early months trying to gauge how the new chair will approach policy and respond to evolving economic conditions.
Importantly, over the long run, the Fed chair does not have a major impact on stock returns. The following table shows the market’s performance during the tenures of past Fed chairs, dating back to the early 1930s (data from Carson Group):

The most important takeaway is that every Fed chair except Eugene Meyer presided over positive stock market returns during their tenure. Meyer is the clear outlier, but he also served during the depths of the Great Depression, a period when the Fed’s policy response is widely viewed as having worsened an already severe economic contraction.
Of course, today’s stock market bears little resemblance to the market that existed back then. Looking at the modern era provides a more relevant comparison (data from 3Fourteen):
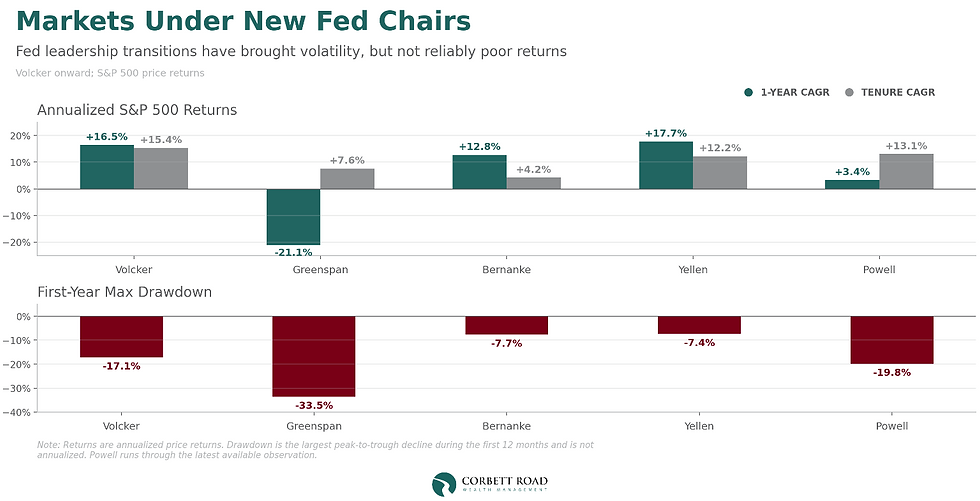
New Fed chairs have often faced early market turbulence. Every chair shown experienced at least a 7% drawdown at some point during the first 12 months of their tenure, suggesting markets often need time to adjust to a new policy regime and assess how a new chair will respond to changing economic conditions. That said, the average calendar-year drawdown for the S&P 500 is about 14%, so these declines are not especially unusual in the context of normal market behavior.
Just as importantly, that volatility has not necessarily translated into poor first-year returns. Volcker, Bernanke, and Yellen all saw double-digit gains during their first years despite meaningful pullbacks along the way. Powell’s first year was also modestly positive, even though investors endured a drawdown that approached 20% during the fourth quarter of 2018.
Alan Greenspan was the notable exception. He took over as Fed Chair in August 1987, just weeks before the S&P 500 peaked for the year. His first 12 months in office coincided with the 1987 crash, when the market suffered a peak-to-trough decline of about 34%. Despite entering the period with strong momentum, the index was down roughly 21% at the end of Greenspan’s first year.
Even so, the 1987 experience stands out as an outlier. In our view, the narrative that markets “test” a new Fed chair is largely driven by the 1987 drawdown under Greenspan. The combination of a leadership transition and one of the most memorable market crashes in history created a powerful precedent that continues to shape investor expectations nearly 40 years later.
The broader takeaway is that while leadership transitions at the Fed can create uncertainty and increase near-term market volatility, history offers little evidence to suggest that a new Fed chair is inherently bearish for stocks. Over the full tenures of the recent Fed chairs shown, the market generated positive returns with annualized gains ranging from roughly 4% under Bernanke to about 15% under Volcker.
In summary, SpaceX may be an extraordinary company, but its IPO valuation leaves little margin for disappointment, especially given the weak first-year track record of many high-profile IPOs. Warsh inherits a Fed that may have less room to ease than investors hoped, with inflation once again becoming the central policy risk. And while markets can be volatile around a new Fed chair, history does not support the idea that leadership changes are automatically bearish for stocks.

Important Disclosures
The chart(s)/graph(s) shown is(are) for informational purposes only and should not be considered as an offer to buy, solicitation to sell, or recommendation to engage in any transaction or strategy. Past performance may not be indicative of future results. While the sources of information, including any forward-looking statements and estimates, included in this (these) chart(s)/graph(s) was deemed reliable, Corbett Road Wealth Management (CRWM), Spire Wealth Management LLC, Spire Securities LLC and its affiliates do not guarantee its accuracy.
The views and opinions expressed in this article are those of the authors as of the date of this publication, are subject to change without notice, and do not necessarily reflect the opinions of Spire Wealth Management LLC, Spire Securities LLC or its affiliates.
All information is based on sources deemed reliable, but no warranty or guarantee is made as to its accuracy or completeness. macrocast™ and microcast™ are proprietary indexes used by Corbett Road Wealth Management to help assist in the investment decision-making process. Neither the information provided by macrocast™ or microcast™ nor any opinion expressed herein considers any investor’s individual circumstances nor should it be treated as personalized advice. Individual investors should consult with a financial professional before engaging in any transaction or strategy. The phrase “the market” refers to the S&P 500 Total Return Index unless otherwise stated. The phrase “risk assets” refers to equities, REITs, high yield bonds, and other high volatility securities.
Corbett Road’s quantitative models utilize a variety of factors to analyze trends in economic conditions and the stock market to determine asset and sector allocations that help us gauge market movements in the short- and intermediate term. There is no guarantee that these models or any of the factors used by these models will result in favorable performance returns.
Individual stocks are shown to illustrate market trends and are not included as securities owned by CRWM. Any names held by CRWM is coincidental. To be considered for investment by CRWM, a security must pass the Firm’s fundamental review process, meet certain internal guidelines, and fit within the parameters of the Firm’s quantitative models.
Spire Wealth Management, LLC is a Federally Registered Investment Advisory Firm. Securities offered through an affiliated company, Spire Securities, LLC, a Registered Broker/Dealer and member FINRA/SIPC. Registration does not imply any level of skill or training.