
THIRD QUARTER 2025 MARKET REVIEW: IS AI A BUBBLE?
- Rush Zarrabian, CFA®

- Oct 15, 2025
- 7 min read
Updated: Dec 31, 2025

Summary
Enthusiasm over advancements in artificial intelligence has fueled a significant stock rally, but in our view, it is not a bubble—at least not yet. While AI has clearly captured investor attention, today’s market leaders are far more profitable and better capitalized than tech names during past bubbles. Speculation exists, but widespread skepticism and strong fundamentals—like earnings, margins, and cash flow—are helping anchor valuations. History shows that not all booms end in busts, and even when they do, timing the top is notoriously difficult. For long-term investors, staying disciplined and diversified remains the smarter path than trying to guess when the momentum will peak.
Q3 saw broad gains, led by a rebound in risk assets. Most asset classes posted strong returns as markets continued to recover from early-year tariff pressures. Small-cap stocks and emerging markets—typically the most volatile major asset classes—led the way with double-digit gains. Gold also surged and is on track for its best year since 1979.
macrocast™ remains modestly positive, indicating a low risk of a recessionary bear market. Our current microcast™ signal remains at an aggressive allocation. Both models continue to suggest a positive outlook for risk assets.
EVERYONE IS ASKING IF AI IS A BUBBLE
Whenever a trend catches fire in the stock market, one question always follows: “Is it a bubble?” As we approach the 3-year anniversary of the launch of ChatGPT, this question has come up a lot more lately:

To answer that question, it helps to revisit the classic ingredients of a market bubble to see how today’s AI-driven rally measures up:
A Big Story: A new technology or idea that convinces investors this time is different.
Yes. AI has been the dominant market theme for nearly three years, capturing imagination and capital alike.
Easy Money: A flood of credit and savings that fuels rapid price gains.
Mixed. Liquidity is flowing in parts of the market, but conditions are far from the ultra-loose environment of recent years.
Herd Behavior & FOMO: Investors chasing returns simply because others are.
Mixed. There’s excitement, but not the kind of frenzy seen in early 2021, and certainly nowhere near the levels of the dotcom bubble.
Detached Valuations: Prices wildly out of step with earnings or fundamentals.
Not yet. Today’s leading AI companies show strong revenue growth, wide margins, and robust free cash flow—factors that still support current valuations.
“Prices Only Go Up” Mindset: Blind optimism and the belief that risk no longer matters.
Not yet. In fact, investor sentiment remains cautious, with plenty of skepticism still in the mix.
LOOKING BACK: WHAT REAL BUBBLES LOOKS LIKE
History shows bubbles often follow a similar pattern: a surge in prices over a relatively short period of time followed by equally sharp declines (table from Bank of America):

While the examples above are arguably cherry picked for maximum effect, history also tells you:
Yes, some bubbles crash hard.
Others fizzle out gradually.
And some — like the early internet and railways — end up justified by future growth.
In other words, not all bubbles are created equal. The key difference lies in what’s fueling the surge. Is it stock market enthusiasm or credit market excess?
Unleveraged equity bubbles—like the dot-com boom, the Nifty Fifty era, and today’s tech disruptors—can wipe out wealth but rarely crush the economy.
Leveraged bubbles—housing, credit, sovereign debt—are far more dangerous. When they burst, they damage household balance sheets and threaten the broader financial system. The best-known examples are the Global Financial Crisis and the Great Depression.
Today’s AI-fueled rally looks more like the former. If it pops, it could hurt, but it’s unlikely to trigger systemic failure. To date, the bulk of the investments in AI have come from the cash flows of some of the largest and most profitable companies in the world—Amazon, Alphabet, Microsoft, and Meta. Still, this is a dynamic we will be watching closely as the AI buildout matures.
WHAT ARE THE NUMBERS SUGGESTING?
The closest parallel to today’s AI boom is the late-1990s dot-com era. The comparison makes sense. Both revolved around transformative changes in computing, communication, and commerce, and both captured the public imagination. But there’s another reason the analogy resonates: many of today’s investors lived through that era. They remember the rush, the hype, and the subsequent crash. That’s very different from, say, the railroad boom of 150 years ago, which exists only in history books.
If we draw a direct comparison with the dot-com era, the numbers suggest we’re not yet in bubble territory.
Today’s leading AI companies are far more profitable than the average tech firm in 1999. Their valuations are underpinned by real earnings, healthy margins, and strong free cash flow. And while prices have certainly risen, they remain well below the extremes seen in past bubbles. The table below, from Goldman Sachs, compares the index weightings and forward P/E ratios to the peak of the dotcom bubble in the year 2000, as well as a couple of other well-known speculative peaks over the past 50 years:

The data suggests the current Big Tech valuations are not as pronounced as previous periods of market euphoria.
WHERE ARE WE IN THE CURRENT CYCLE?
Every market cycle is different, even when driven by similar themes.
While the rally since late 2022 has been strong, we are nowhere near the explosive returns seen during the late 1990s. Investor sentiment remains cautious, and market leadership, while concentrated, is underpinned by earnings.
Take a look at these numbers comparing the current Nasdaq rally to the dot-com era (from Urban Carmel):

While the rally since the October 2022 bottom has been impressive, it’s still not in the same league.
HOW SHOULD INVESTORS NAVIGATE THIS ENVIRONMENT?
The most prudent method for handling uncertainty is through discipline, not guesswork.
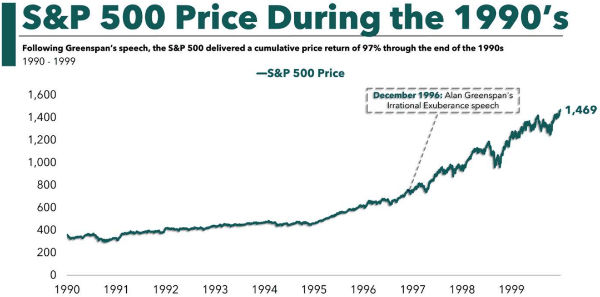
While you don’t want to chase performance, stepping aside too early can also be costly. When Fed Chair Alan Greenspan warned of “irrational exuberance” in late 1996, the market more than doubled over the next 3.5 years (from Ben Carlson):
Even after the dot-com crash, when the S&P 500 dropped nearly 50% and the Nasdaq 100 plunged a staggering 83%, long-term returns over the decade starting in 1995 remained solid. This is why blindly “taking chips off the table” just because things feel expensive can be costly (chart from Bespoke):

At the same time, it is important not to discount the value of a globally diversified approach. If an AI-driven rally were to deflate, portfolios with less concentration in Big Tech and broader exposure across Europe, small caps, and emerging markets would likely prove more resilient.
And in any future bear market, tactical flexibility will also be critical. The ability to adjust risk exposure meaningfully in response to changing market conditions, using a systematic process, can help manage volatility and preserve capital.
THIRD QUARTER ASSET CLASS REVIEW: A GLOBAL RISK ON RALLY
The following table highlights major asset class returns from the third quarter of the year (from Charles Schwab):

Some additional insights from the above table:
In Q3, nearly every major asset class posted gains. Equity indices rallied strongly, with returns ranging from 4.8% to 12.4%.
The “riskiest” segments led the charge. Small-cap and emerging market stocks—historically, the most volatile major asset classes—both surged by double digits. While small caps still trail year to date, emerging markets are up nearly 30%, driven by a weaker dollar and a rebound in China, which remains the index’s largest component.
Developed international stocks lagged in Q3 but are up 25% year to date. The MSCI EAFE Index—which tracks Europe, Australia, and Japan—posted gains for the quarter but trailed other major equity benchmarks. Still, they are up over 25% year to date, which marks a strong rebound after rising just 4% in 2024 and significantly underperforming U.S. markets.
Bonds enjoyed another strong quarter. The U.S. aggregate bond index was up 2% and is up 6% year to date. This is the best performance for bonds through Q3 since 2020.
Gold is having a historic run. Gold (not shown in the table) surged nearly 12% in September alone and is up an extraordinary 46% year to date, the metal’s best performance since 1979! While gold is often viewed as an inflation hedge, this year it has acted more as a shield against dollar weakness and rising geopolitical risk.
In summary, the AI-driven rally has clearly captured investor attention. While some worry about a bubble, the fundamentals tell a different story: strong earnings, healthy cash flows, and valuations that, so far, reflect real business strength. History reminds us that not every boom ends in a bust—some mark the beginning of lasting transformation. Even if your view is that AI is a bubble, and even if the rally does deflate, bubbles are notoriously hard to time, and markets often end up higher than when concerns first emerge. With disciplined risk management and broad diversification, investors are well-positioned to take part in the opportunity while staying resilient through whatever comes next.
Important Disclosures
The chart(s)/graph(s) shown is(are) for informational purposes only and should not be considered as an offer to buy, solicitation to sell, or recommendation to engage in any transaction or strategy. Past performance may not be indicative of future results. While the sources of information, including any forward-looking statements and estimates, included in this (these) chart(s)/graph(s) was deemed reliable, Corbett Road Wealth Management (CRWM), Spire Wealth Management LLC, Spire Securities LLC and its affiliates do not guarantee its accuracy.
The views and opinions expressed in this article are those of the authors as of the date of this publication, are subject to change without notice, and do not necessarily reflect the opinions of Spire Wealth Management LLC, Spire Securities LLC or its affiliates.
All information is based on sources deemed reliable, but no warranty or guarantee is made as to its accuracy or completeness. macrocast™ and microcast™ are proprietary indexes used by Corbett Road Wealth Management to help assist in the investment decision-making process. Neither the information provided by macrocast™ or microcast™ nor any opinion expressed herein considers any investor’s individual circumstances nor should it be treated as personalized advice. Individual investors should consult with a financial professional before engaging in any transaction or strategy. The phrase “the market” refers to the S&P 500 Total Return Index unless otherwise stated. The phrase “risk assets” refers to equities, REITs, high yield bonds, and other high volatility securities.
Use of Indicators
Corbett Road’s quantitative models utilize a variety of factors to analyze trends in economic conditions and the stock market to determine asset and sector allocations that help us gauge market movements in the short- and intermediate term. There is no guarantee that these models or any of the factors used by these models will result in favorable performance returns.
Individual stocks are shown to illustrate market trends and are not included as securities owned by CRWM. Any names held by CRWM is coincidental. To be considered for investment by CRWM, a security must pass the Firm’s fundamental review process, meet certain internal guidelines, and fit within the parameters of the Firm’s quantitative models.
Spire Wealth Management, LLC is a Federally Registered Investment Advisory Firm. Securities offered through an affiliated company, Spire Securities, LLC, a Registered Broker/Dealer and member FINRA/SIPC. Registration does not imply any level of skill or training.